You're not reading the latest revision of this page, which is
here.
Visualization
Visualizations in problems
Any question can be augmented by a canvas with a plot of several functions.
\plotF{1}{f} this f is registered for drawing (as 1st drawable function, the next one e.g. \plotF{2}{g})\plotFrom{1}{ _number_} the left bound of the (first) function's domain is defined\plotTo{1}{ _number_} the right bound of the function's domain is defined \plotColor{1}{ _color_} to define the plot color (black, red, green, blue, yellow, magenta, pink, gray, orange, white are possible values, case is ignored, if you write vanilla or something it's interpreted as white :v: )\plotLeft{ _number_} to define the leftmost canvas ordinate, and \plotRight{ _number_} for the rightmost one\plotSize{ _integer_} to define the size of the canvas, default is 300\plotRatio{keep} to keep the ratio of the two coordinate axises 1:1, default is 'auto' that scales the y-axis based on the functions that are plotted
Example:
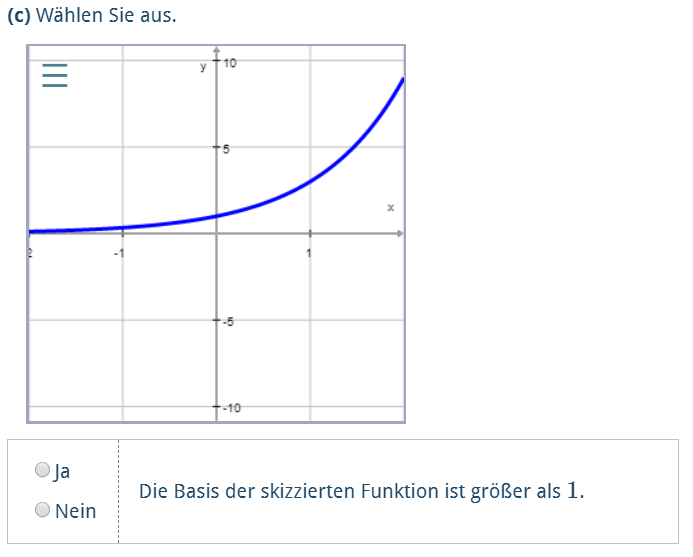
1 2 3 4 5 6 7 8 9 10 11 12 13 14 15 16 17 18 19 20 21 | \begin{question}
\begin{variables}
\randint{a}{2}{4}
\function{f}{a^x}
\end{variables}
\text{Wählen Sie aus.}
\type{mc.yesno}
\plotF{1}{f} % % the function a1 is defined below in 'variables' in the usual way
\plotFrom{1}{-2} % % and is plotted starting from 0.0
\plotTo{1}{2} % % and ending in 1.0 , it's a quarter of a circle
\plotColor{1}{blue} % % colored blu
\plotLeft{-2} % % defines the canvas bound left
\plotRight{2}
\begin{choice}
\text{Die Basis der skizzierten Funktion ist größer als $1$.}
\solution{true}
\end{choice}
\end{question}
|
Visualizations in articles
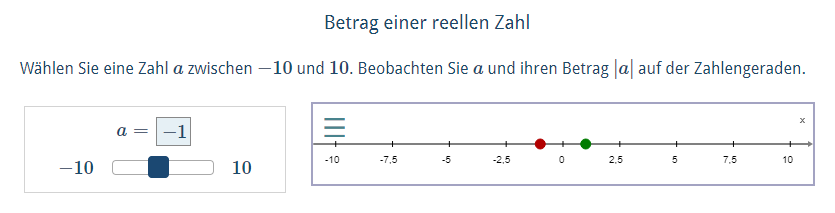
Example:
1 2 3 4 5 6 7 8 9 10 11 12 13 14 15 16 17 18 19 20 21 22 23 24 25 26 27 28 29 30 31 32 33 34 35 36 37 38 39 40 41 42 43 44 45 | \begin{genericGWTVisualization}[600][600]{gwtviz}
\title{Betrag einer reellen Zahl}
\text{
W\"ahlen Sie eine Zahl $a$ zwischen $-10$ und $10$. Beobachten Sie $a$
und ihren Betrag $|a|$ auf der Zahlengeraden.
}
\begin{canvas}
\plotSize{500,80}
\plotLeft{-11}
\plotRight{11}
\plot[numberLine]{p1,p2}
\slider{slider}
\end{canvas}
\text{
\IFELSE{var(n) >= 0}{
Die Zahl $a$ is positiv oder Null. Somit
ist $a=|a|$ und auf der Zahlengeraden durch einen grünen Punkt dargestellt.
}{
Die Zahl $a$ ist negativ. Somit ist $a = -|a|$. Die Zahl $a = \var{a}$ ist durch einen roten Punkt
auf der negativen Halbachse dargestellt. Der Betrag $|a|=\var{abs}$ ist auf der postiven Halbachse als gr\"uner Punkt dargestellt.
}
}
\begin{variables}
\number[editable]{n}{real}{-1}
\number{a}{real}{var(n)}
\slider{slider}{n}{-10}{10}
\function{f}{real}{|var(n)|}
\number{abs}{real}{abs(var(n))}
\point{p1}{real}{var(n),0}
\point{p2}{real}{var(abs),0}
\circle{p3}{real}{var(p2),0.5}
\end{variables}
\label{n}{$a= $}
\color{p1}{DARK_RED}
\color{p2}{DARK_GREEN}
\end{genericGWTVisualization}
|
Create the first visualization in a document
For the first visualization in an article a few steps are necessary.
WebMiau offers a shortcut to take it off you.
Put the courser on the position where you want to use the visualization and press Alt + W.
WebMiau creates the following things:
- It creates an entry into the components in the top of the file
- It imports the necessary package for you
\usepackage{mumie.genericvisualization}
- It creates a visualization wrapper for all visualizations in this article
1 2 3 | \begin{visualizationwrapper}
...
\end{visualizationwrapper}
|
- It creates the visualization environment
1 2 3 | \begin{genericGWTVisualization}[100prc][900]{gwtviz}
...
\end{genericGWTVisualization}
|
Create another visualization in a document
If you need more than one visualization in a document, you can insert
another visualization within the visualizationwrapper environment with ALT-G
1 2 3 4 5 6 7 8 9 10 11 12 13 | \usepackage{mumie.genericvisualization}
\begin{visualizationwrapper}
\begin{genericGWTVisualization}[600][600]{gwtviz}
...
\end{genericGWTVisualization}
\begin{genericGWTVisualization}[600][600]{gwtviz}
...
\end{genericGWTVisualization}
\end{visualizationwrapper}
|
Create visualization content
Writing text
With the text command you can write texts which explains the visualization. As value you can use latex. If you want
to display a variable in the text (for example in formulas) you can use the tex command \$\var{a}\$
1 2 3 | \text{$g$ is a line that runs through $P_1 = \var{p1}$ and $P_2 = \var{p2}$} %write the content in a line
\text{....} % next line
\text[c]{$y = mx + b = \var{mRes}x + \var{b}$} %write the formula in next line with center alignment
|
Unlike in the generic problem, \var{p1} will be replaced with an interactive Object which might change it's
value if it has dependency to another variable, or even gets edited from the user.
Thus, the it cannot be used as an argument in a \frac command or be used as an exponent or index.
As a workaround, instead of using
\text{$\frac{\var(a)}{\var{b}}$} you should create a number variable with type operation
1 2 3 4 5 | \begin{variables}
\number{a}{real}{1}
\number{b}{real}{2}
\number{adivb}{operation}{a/b}
\end{variables}
|
and later display the variable adivb \text{$\var{adivb}$}